Manager panel and real-time statistics: how to monitor your Server
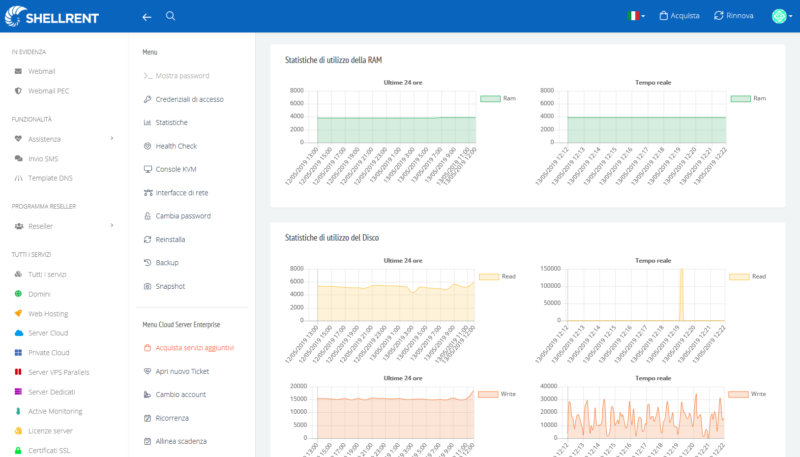
Our Manager Panel collects all statistical metrics at the virtual machine and operating system level, displaying them in an interactive and easy-to-read graphical interface. All graphs make CPU, RAM and Disk I / O speed statistics instantly available.
View all the data of your Cloud or Dedicated Servers
Just select the list of active servers under your profile and their associated information. In a single section you can view the server name, the price and the resources assigned.
Analyze the speed of the storage unit
The graph reports the disk read and write speed, making it understandable when the server requires an increase in resources to ensure proper operation.
Restart in total autonomy with 1 simple click
In case of need you can turn off or restart your server with a single click to guarantee maximum autonomy.
Monitor CPU, RAM and Disk usage load
When a performance problem is detected, you need to check system-level information such as CPU, RAM or Disk usage. The Manager Panel collects all important parameters in one place to correlate data and simplify problem diagnostics.
Not satisfied with the power of your Cloud Server?
Increase the resources of your Cloud Server directly from the Manager Panel in a few clicks or add CPU, RAM or Disk Space during the purchase phase.